
What Color is Your Planet?
By Jim Plaxco, July 2005As you explore this web site you will find quite a few color images of Mars. Did you know that all of these images started out as black and white? When you see color pictures taken by the Viking orbiters and landers, Pathfinder, the Mars Exploration Rovers, Mars Global Surveyor, and Mars Odyssey, you are seeing images that were constructed from separate, individual black and white images. What follows is a brief overview of the process by which a color image is created from a series of black and white frames.
Instead of taking full color pictures, the cameras on these missions use filter wheels that allow only specific wavelengths of light to reach the camera's light sensors. This method of taking pictures makes it possible for scientists to better understand the composition of the surface being photographed. In order to produce a color image, separate exposures of the same target using the different filters must be composited together. The one big problem with this process is that the wavelengths associated with each filter will not necessarily combine together to yield a color image that would be the same as what a person would see. The human eye is sensitive to light in the range of wavelengths from approximately 400 to 700 nanometers (see note 1). Contrast this with the Mars Global Surveyor MOC Wide Angle Camera which has two filters: a red filter that sees at 580 nanometers and a blue filter that sees at 400 to 450 nanometers. Sorry but there is no green filter. Obviously the Mars Global Surveyor MOC Wide Angle Camera perceives only a fraction of the visible wavelengths that the human eye does.
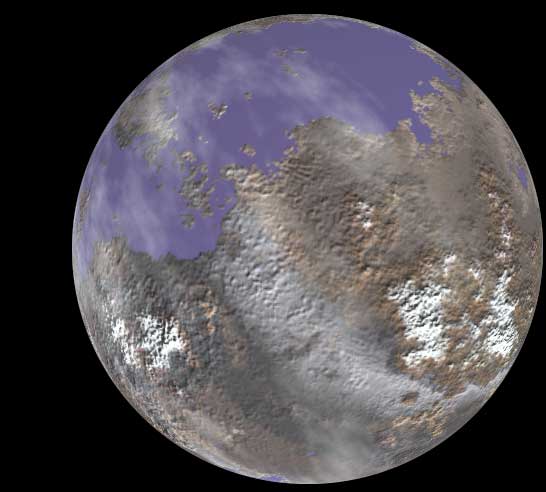
Figure 1. The Planet Epsilon
To illustrate the process of how a color image is constructed form separate black and white filter images we start with a color image of an imaginary world. Let's call this world Planet Epsilon. Figure 1 shows us the planet in full, living color. The colors that we see in this image are a composite of three separate color channels. These channels are red, green, and blue. This is where the term RGB comes from.
Now it is time for our Epsilon Explorer 1 to take a picture of the target world. Our probe's camera is equipped with three filters: one red, one green, and one blue. Note that in real life a camera may be equipped with a fewer or greater number of filters. To get our single color picture, we will actually take three pictures of the planet: one each for each of our filters. These pictures are then transmitted back to a receiving station on our home world where our image processing specialists will assemble the color version.
Note that this exercise differs from the real world situation in one very important aspect: we are using the full spectrum of colors contained in the image. With an actual mission, like Viking or Mars Global Surveyor, we are working with only a subset of the visible spectrum.
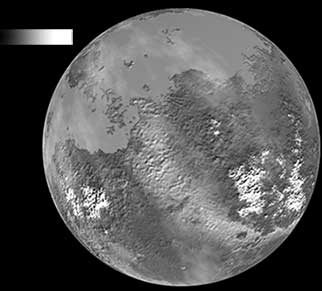
Figure 2. The Blue Channel Component
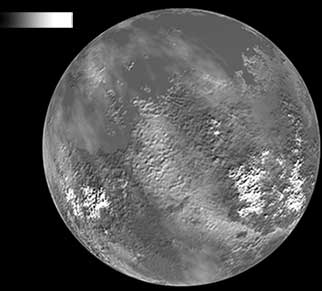
Figure 3. The Green Channel Component
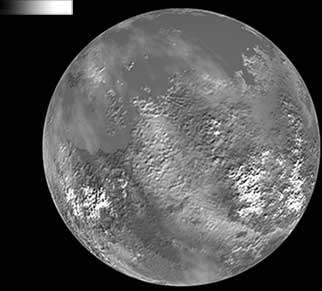
Figure 4. The Red Channel Component
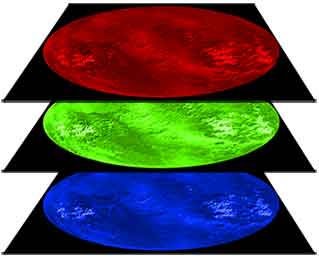
Figure 5 The RGB Image Stack
Let's take a look at these color channels separately. In Figure 2, we see the blue channel component of our planet. Figure 3 shows us the green channel and Figure 4 shows us the red channel. Each of these images is slightly different reflecting the different amounts of red, blue, and green required to create the final full color image. Look particularly at the difference in the appearance of the water-covered areas in the blue (Figure 2) and green (Figure 3) channels.
Notice that there is no color in any of these images: only a range of grays from black to white. A black pixel contributes no color to the image whereas a white pixel contributes the maximum amount possible. In each of these channels, the range of values for each pixel is from 0 to 255, for 256 possible values. Zero represents black and 255 represents white. A value of 127 is a 50 percent gray.
Note that for each of the individual channel images I have added a small gradient bar in the upper left hand corner of the image. The intensity of the pixels in the bar goes from 0 at the left end of each bar to 255 at the right end. I have done this so that when the final image is assembled, you can clearly see the color associated with each of the channels.
The team assembling our image are aware of variables like exposure, lighting conditions, detector sensitivity at a particular wavelength. These are all factors that affect the individual images. When these separate frames are subsequently combined, these factors must all be taken into account in order to produce as accurate a color rendition as possible.
The color image is created by stacking the individual black and white images on top of one another. This process is shown in Figure 5. It is typical to put at the bottom of the stack the image that was taken with the shortest wavelength filter, in this case the blue component. The image taken with the longest wavelength filter, in this case red, will be placed on the top of the stack. The intermediate wavelength filter images will go somewhere in between, ordered from shortest at the bottom to longest at the top. Next, a color that is appropriate for each filter's image must be assigned to that image.
The Finished Product
Figure 6 shows one particular representation of our data. In this image the only action that was taken was to assign a color to each of our three black and white images. You can clearly see the value of these colors in the gradient bars in the upper left corner of the image.
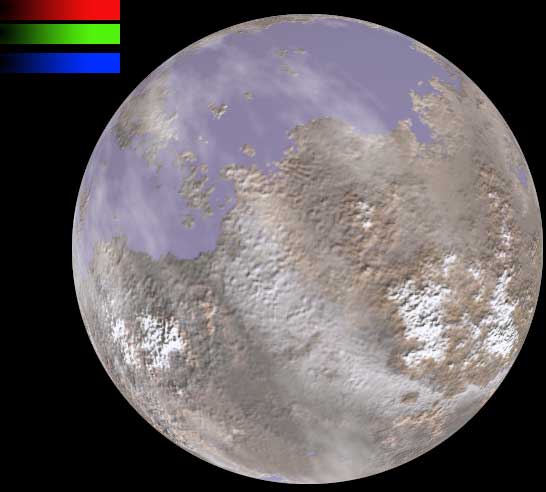
Figure 6. The Blue, Green, and Red Channels Assembled
It frequently happens that the range of tones in an image is such that subtle details are hard to perceive. To bring out this detail, we may increase the saturation of the individual color channels and/or stretch the contrast in one or more of the channels. For Figure 7 below, color saturations were increased and the contrast was stretched in each of the channels to create a more striking rendition of the planet.
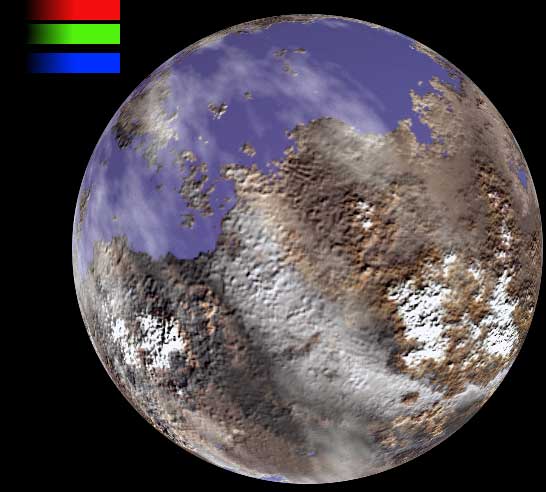
Figure 7. An Enhanced Color Version
In Figure 8 you can see the differences between the processed version of planet Epsilon (left) and the original image that we started from (right). It is important to note that most planetary images undergo some form of manipulation in order to bring out small details that may be hidden in the picture. Such manipulations can sometimes fool people into seeing things that aren't really there. The most recent example that comes to mind is a Mars Express image of Reull Vallis that has a blue coloring in the channel. Some people have seen this and insisted that this was a large body of liquid water exposed on the surface of Mars.
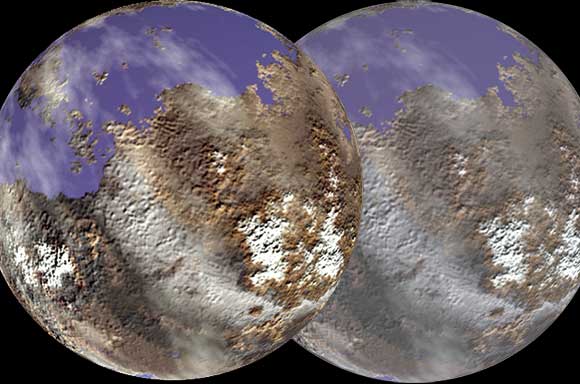
Fig 8. Enhanced vs the Original Epsilon
Now you know the secret of how the beautiful color images of the planets are created. This also holds true for grand visions taken from the Hubble Space Telescope.
Footnote
When we talk about visible light we are talking about a specific portion of the much larger electromagnetic spectrum. One way in which electromagnetic energy is measured is by its wavelength. The wavelength is the distance from one point on a periodic wave to the same point on the next wave. The shorter this distance, the higher the energy level. Sometimes wavelength is given in nanometers. A nanometer is one billionth of a meter long so 1 billion nanometers equals 1 meter. Sometimes wavelength is given in microns. A micron is one millionth of a meter long so 1 million microns equals 1 meter. Therefore 1 micron is equal to 1,000 nanometers.